
Climate Wrap-Up India 2025: Extreme Heat, Floods, Cyclones and What They Reveal About India’s Climate Future
2025 was marked by a series of climate crises across India — from extreme heat and cyclones to floods, cloudbursts, and widespread infrastructure damage. These were not isolated events or seasonal anomalies. Together, they revealed a deeper shift in how climate risks are unfolding across regions, cities, and supply chains.
From the mountains of Uttarakhand to the plains of Punjab, from heat-stressed cities to cyclone-hit coastlines, climate extremes affected lives, livelihoods, and economic systems throughout the year.Below are five major climate events from 2025 that stood out — not just for their scale, but for what they signal about the future India is heading into.
1. UTTRAKHAND CLOUDBURST
The Disaster
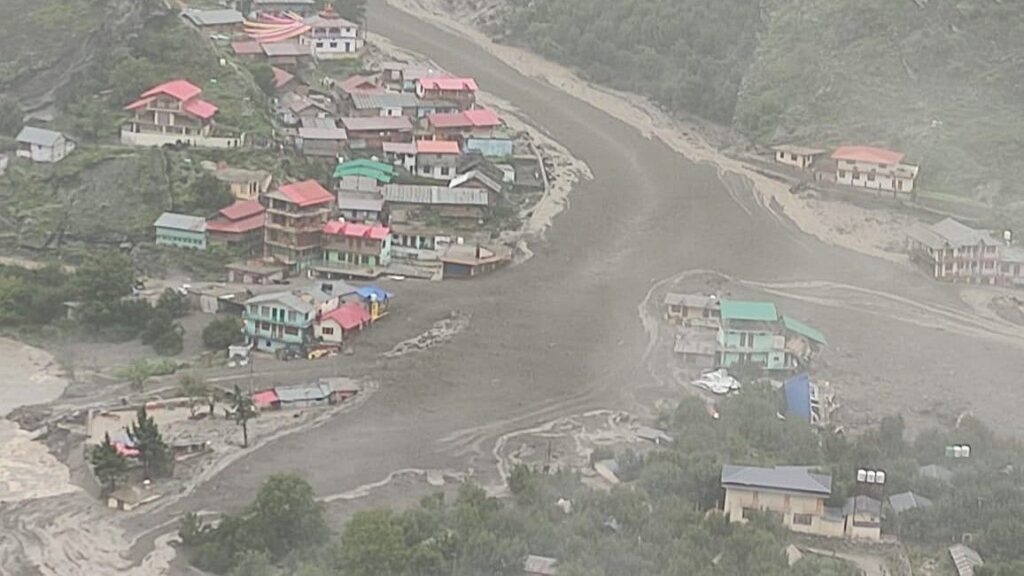
In August 2025, a severe cloudburst in Uttarkashi triggered flash floods that devastated high-altitude villages like Dharali and Sukhi Top. Dharali was completely destroyed as rivers carried massive silt and debris, with subsequent cloudbursts worsening damage in nearby areas.
Devastation by Numbers
- At least 5 deaths confirmed, with 50+ people initially missing
- 11 Indian Army soldiers went missing from a nearby post
- Over 70 people rescued in the first 24 hours
- 100+ people affected across multiple villages
- Rainfall of 21cm (8.3 inches) recorded in 24 hours—more than double the cloudburst threshold
- Debris flow velocity: 57 meters per second (190 feet per second)
- 86,000 square meters of land moved down the hillside
Climate Vulnerability
The India Meteorological Department defines a cloudburst as rainfall exceeding 100mm per hour. These intense downpours, increasingly common due to climate change, combine with:
- Unstable mountainous terrain at 1,000-2,000m elevation
- Rapid glacial melting in the Himalayas
- Unregulated construction and deforestation
- Poor building standards in ecologically sensitive zones
2. APRIL HEATWAVES
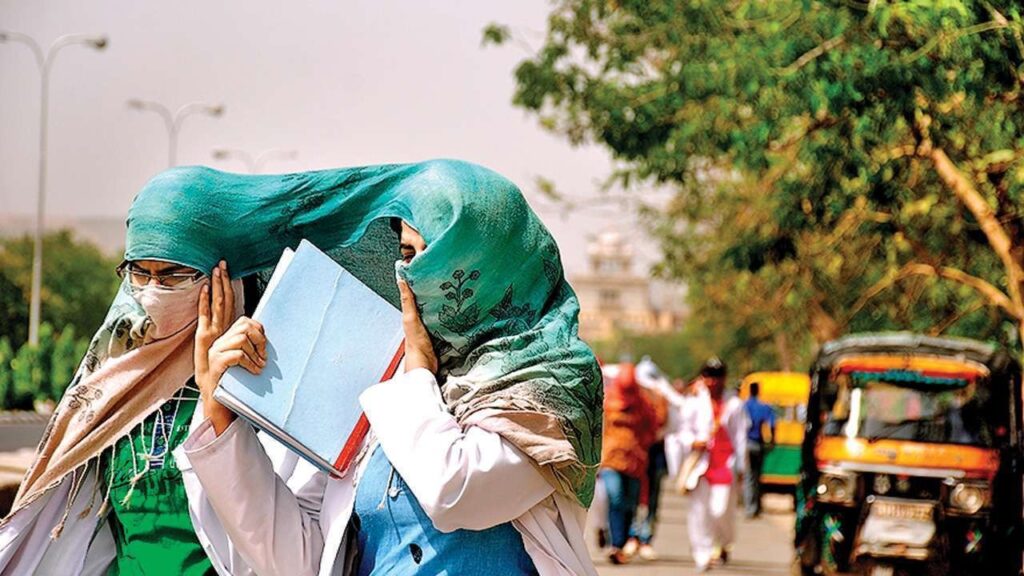
From March to June 2024, India endured one of its longest and most lethal heatwaves, with temperatures repeatedly crossing 50°C in multiple cities.
Shocking Statistics
- 192 suspected heatstroke cases and 14 officially confirmed deaths were reported.
- Independent media analysis suggested significant undercounting, identifying at least 84 heat-related deaths, pointing to gaps in reporting and response systems.
- According to the India Meteorological Department (IMD), heatwave days increased by over 55% in 2025 compared to the 2010s, indicating a sharp rise in frequency and severity.
- 24 nights in Delhi with temperatures above 30°C (double the 2001-2010 average)
- Nighttime temperatures rose 4.4°C faster than daytime temperatures
Breaking Records
2024 was confirmed as India’s warmest year since 1901. The decade 2015-2024 was the warmest on record with an average temperature anomaly of 0.31°C. The India Meteorological Department introduced a new category: “warm nights” and “severe warm nights” to describe the unprecedented nighttime heat.
3. PUNJAB FLOODS

The Crisis
Punjab experienced devastating floods in September 2025 from extreme monsoon rains, impacting all 23 districts and causing widespread destruction. Heavy downpours, worsened by climate change and poor urban planning, led to massive displacement. Northern India reels from this as one of its worst flood crises.
Key statistics
- Nearly 2 million people (≈20 lakh) were affected across over 2,000 villages.
- All 23 districts of Punjab were declared flood-hit, marking the state’s worst flooding since 1988.
- 48–51 deaths were officially reported due to flooding and related incidents.
- Over 3.87 lakh people were displaced from their homes.
- More than 176,000 hectares (over 4 lakh acres) of farmland were submerged, severely impacting agriculture.
- Estimated financial losses exceeded ₹13,000 crore, affecting infrastructure, crops, and livelihoods.
Root causes
The disaster stemmed from a dangerous combination: Punjab received 43% above-normal rainfall in July. This extreme precipitation, coupled with sudden water releases from Bhakra, Pong, and Ranjit Sagar dams without adequate warning, overwhelmed Punjab’s drainage systems.
4. CYCLONE MONTHA
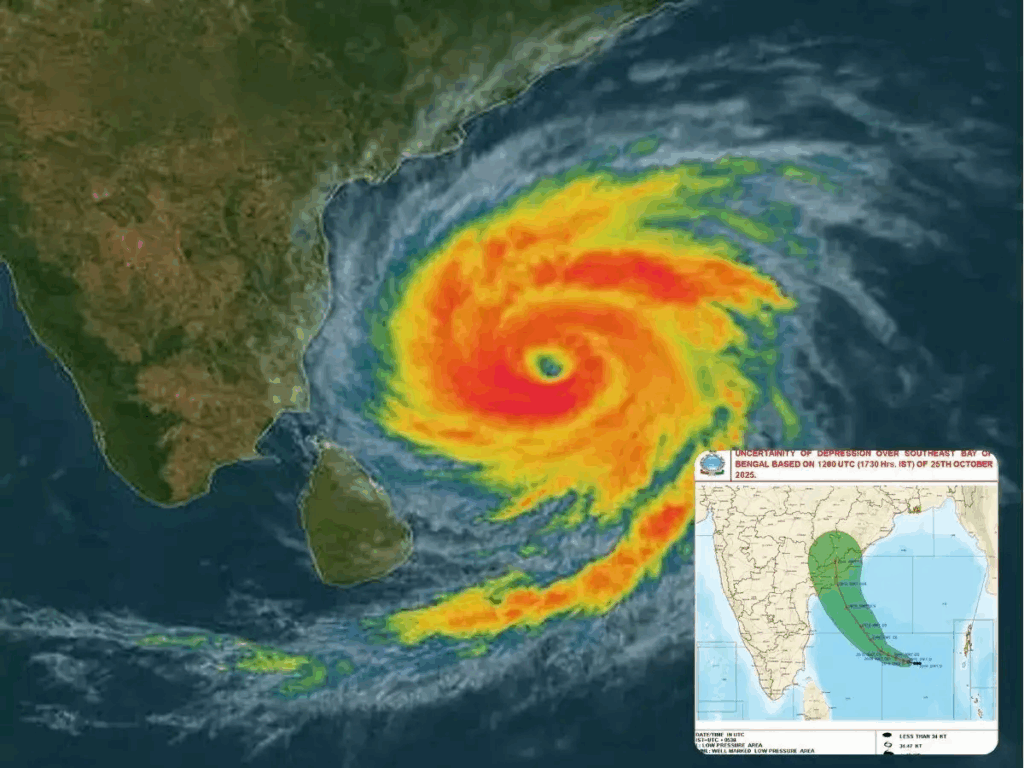
The Catastrophe
In late October 2025, Cyclone Montha started to develop over the southeast Bay of Bengal. Due to favorable wind patterns and warm sea temperatures, it began as a low-pressure system but soon developed strength. The cyclone turned into a Severe Cyclonic Storm as it became stronger and approached the coast of Andhra Pradesh on October 28 causing widespread flooding and disruption across Andhra Pradesh and Telangana.
Data reports
- 87,000 hectares of crops were damaged across affected regions.
- 14 bridges and multiple roads suffered damage, disrupting transport and connectivity.
- In Uppada, 61 houses were damaged due to flooding and strong winds.
- 268 trees were uprooted in Narasapuram, causing localised destruction.
- 42 cattle were reported dead across the state.
- Around 1.8 million people were impacted by the cyclone and subsequent flooding.
5. AIR QUALITY CRISIS
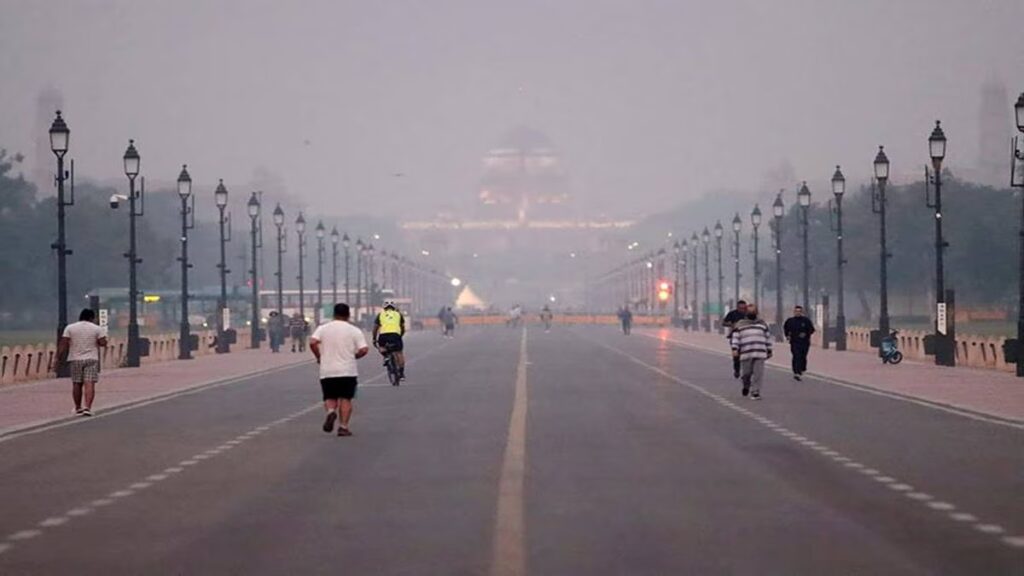
The crisis
India’s air pollution crisis kills more people annually than any single extreme weather event. November-December 2024 saw Delhi experience its worst air quality in recorded history, with the Supreme Court calling the capital “worse than hell.”
Catastrophic Statistics
- AQI reached 1,200 on November 12, 2024—off the standard hazard scale
- Peak station reading: 795-806 AQI on November 18 (highest in four years)
- 1.5-2 million deaths annually from air pollution across India
- 2.2 million children in Delhi have irreversibly damaged lungs
- Over 200,000 respiratory illness cases in Delhi in just 3 years
- PM2.5 levels: 213-320 µg/m³ (14-21 times WHO safe limits)
- Visibility dropped to 200 meters at Safdarjung Airport
- Annual average PM2.5: 104.7 µg/m³ (more than double national standard)
- Breathing Delhi air equivalent to smoking 2.3-2.4 cigarettes daily
- Economic loss: $4.84 trillion globally in 2022 (4.7% of global GDP)
Emergency records
As air quality deteriorated to severe levels, authorities implemented emergency measures across Delhi–NCR. These included strict vehicle restrictions on older petrol and diesel vehicles, suspension of non-essential construction and highly polluting industries, and strong public health advisories urging reduced outdoor exposure. Residents were encouraged to shift to cleaner transport options and take protective steps indoors as pollution levels posed serious health risks, especially for vulnerable groups.
If 2025 showed us anything, it’s this:
Climate change is no longer a future scenario, it is a present-day operating condition. The next step is not panic, but preparation — through better data, smarter design, resilient systems, and transparent impact measurement.
At Untrash, we believe climate action must be measurable, practical, and built into how products and systems are designed — not treated as an afterthought.
